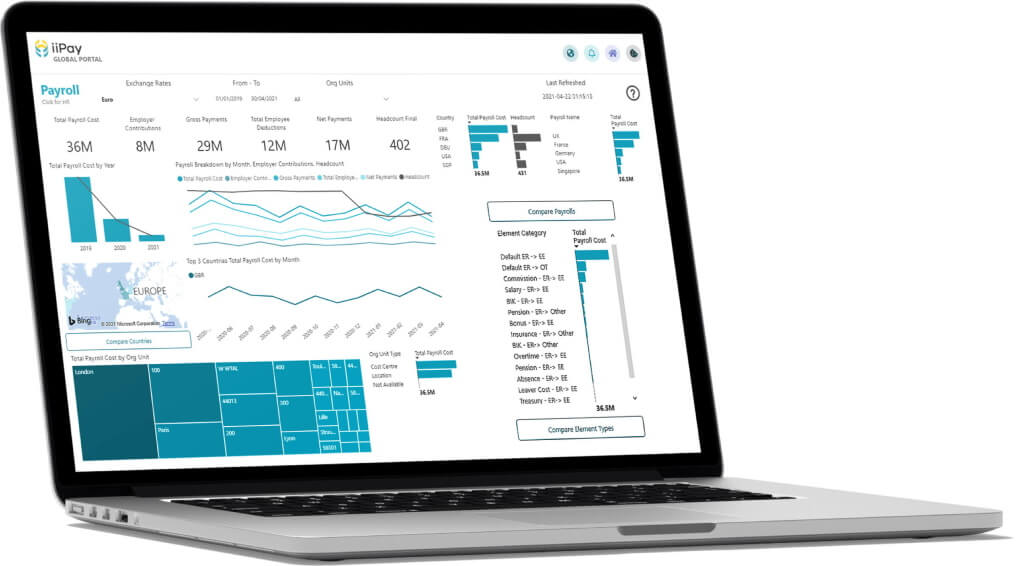
Data visualizations put you in control
- Make better decisions with real-time analysis
- Explore payrolls to find discrepancies
- See the relative performance between regions and entities
- Assess costs across the various pay elements

Payroll data drives better decisions
- Instantly see global data aggregation. It’s built right in.
- No more spreadsheets or manual calculations.
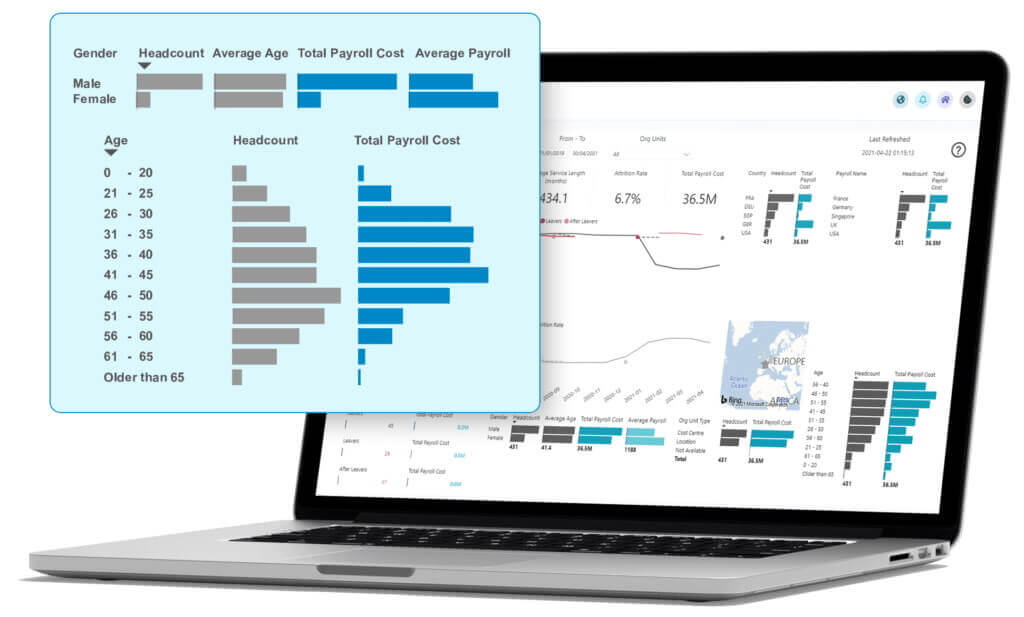
- Address gender and age questions
- Understand high attrition rates globally and for specific regions
- Compare payroll elements like headcounts, overtime, absences, payments, leavers, salary changes, etc.

Leverage the power of payroll data
Investigate thousands of business-transforming data sets from the Payroll Dashboard. Totals are presented based on the filters users select. Simply hover over any chart to view details.
LEARN MORE

The HR dashboard
Key human resource insights from payroll data empowers business leaders with objective facts. The HR Dashboard presents totals for Headcount, Starters, Leavers, and After Leavers based on the filters selected.
Example: Gender and Age Reports
Pay equality initiatives require data that is often regional or local. Compliance in the UK and most EMEA countries require timely reports.
Insight 2.0 Outcome:
“I just ran the gender pay reports using Insight 2.0 in minutes! Last quarter it took a full day to pull all of the data from multiple systems and build a spreadsheet manually.”
JUST CLICK
Just click the new Insight 2.0 tile on the homepage to put your data to work


